Slow incident triage
Operators can start from grouped health signals instead of jumping between raw object tables, terminals, and ad hoc commands.
Home / BeaverDeck
A self-hosted Kubernetes operations workspace for Cluster Insights, resource inspection, logs, exec sessions, and common day-2 actions. GPU visibility and capacity signals help teams understand how expensive compute is used by AI workloads.
BeaverDeck is built for teams that need to shorten the path from a cluster signal to a controlled action.
Operators can start from grouped health signals instead of jumping between raw object tables, terminals, and ad hoc commands.
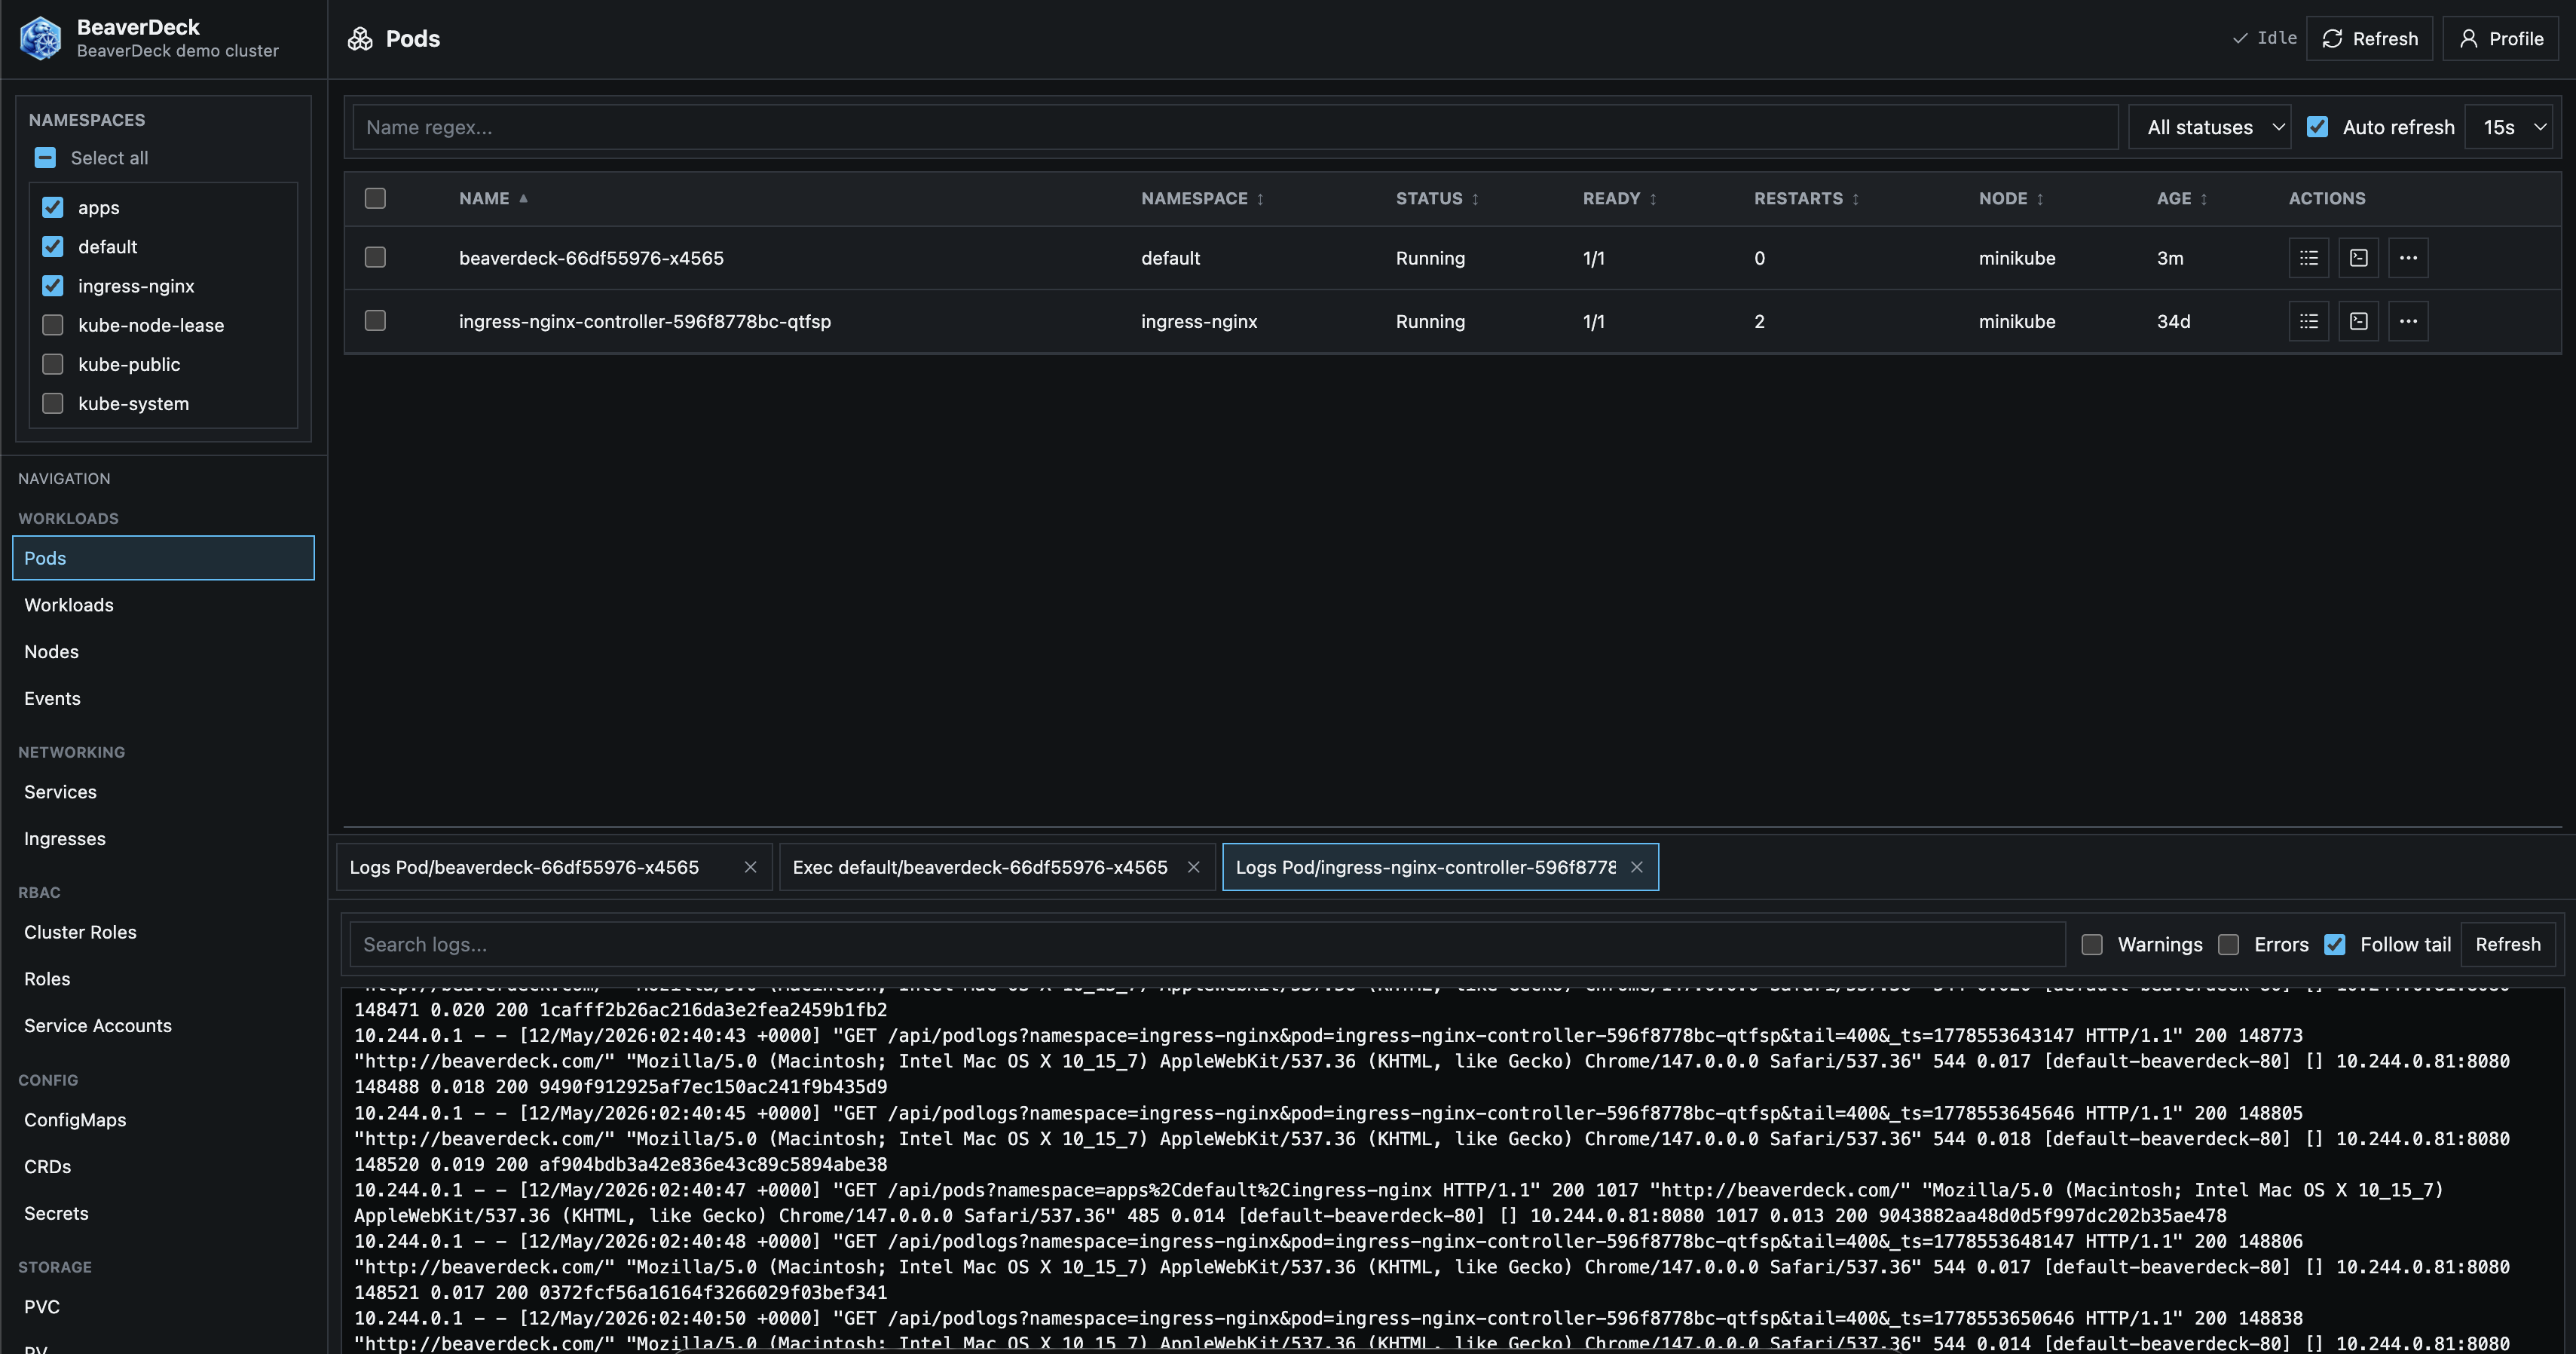
Logs, manifests, exec sessions, YAML apply, scaling, restarts, drains, deletes, and RBAC-aware actions live in one workspace.
GPU visibility and capacity signals help teams understand AI workload placement and reduce waste on costly infrastructure.
Inspect Kubernetes state, triage findings, and carry out common day-2 operations from one self-hosted workspace.
Review grouped findings for nodes, workloads, GPU capacity, networking, storage, security, and configuration.
Browse common Kubernetes resources, events, manifests, and relationships without switching between separate tools.
Stream workload logs and open terminal sessions, including explicit container selection for multi-container pods.
Apply YAML, edit manifests, scale or restart workloads, and perform node or resource actions under BeaverDeck permissions.
Surface allocation pressure, scheduling constraints, idle allocations, fragmentation, quotas, and workload placement signals.
Run BeaverDeck in your cluster with local users or configured Google, OIDC, and Microsoft Entra ID authentication.
BeaverDeck stays focused on practical workflows, clear resource state, and predictable ownership.
Start from useful signals, then get to the resource, log, manifest, or action behind the signal.
Improve understanding of costly infrastructure, including GPU capacity used by AI workloads.
Keep deployment, access control, and operational configuration inside infrastructure you operate.
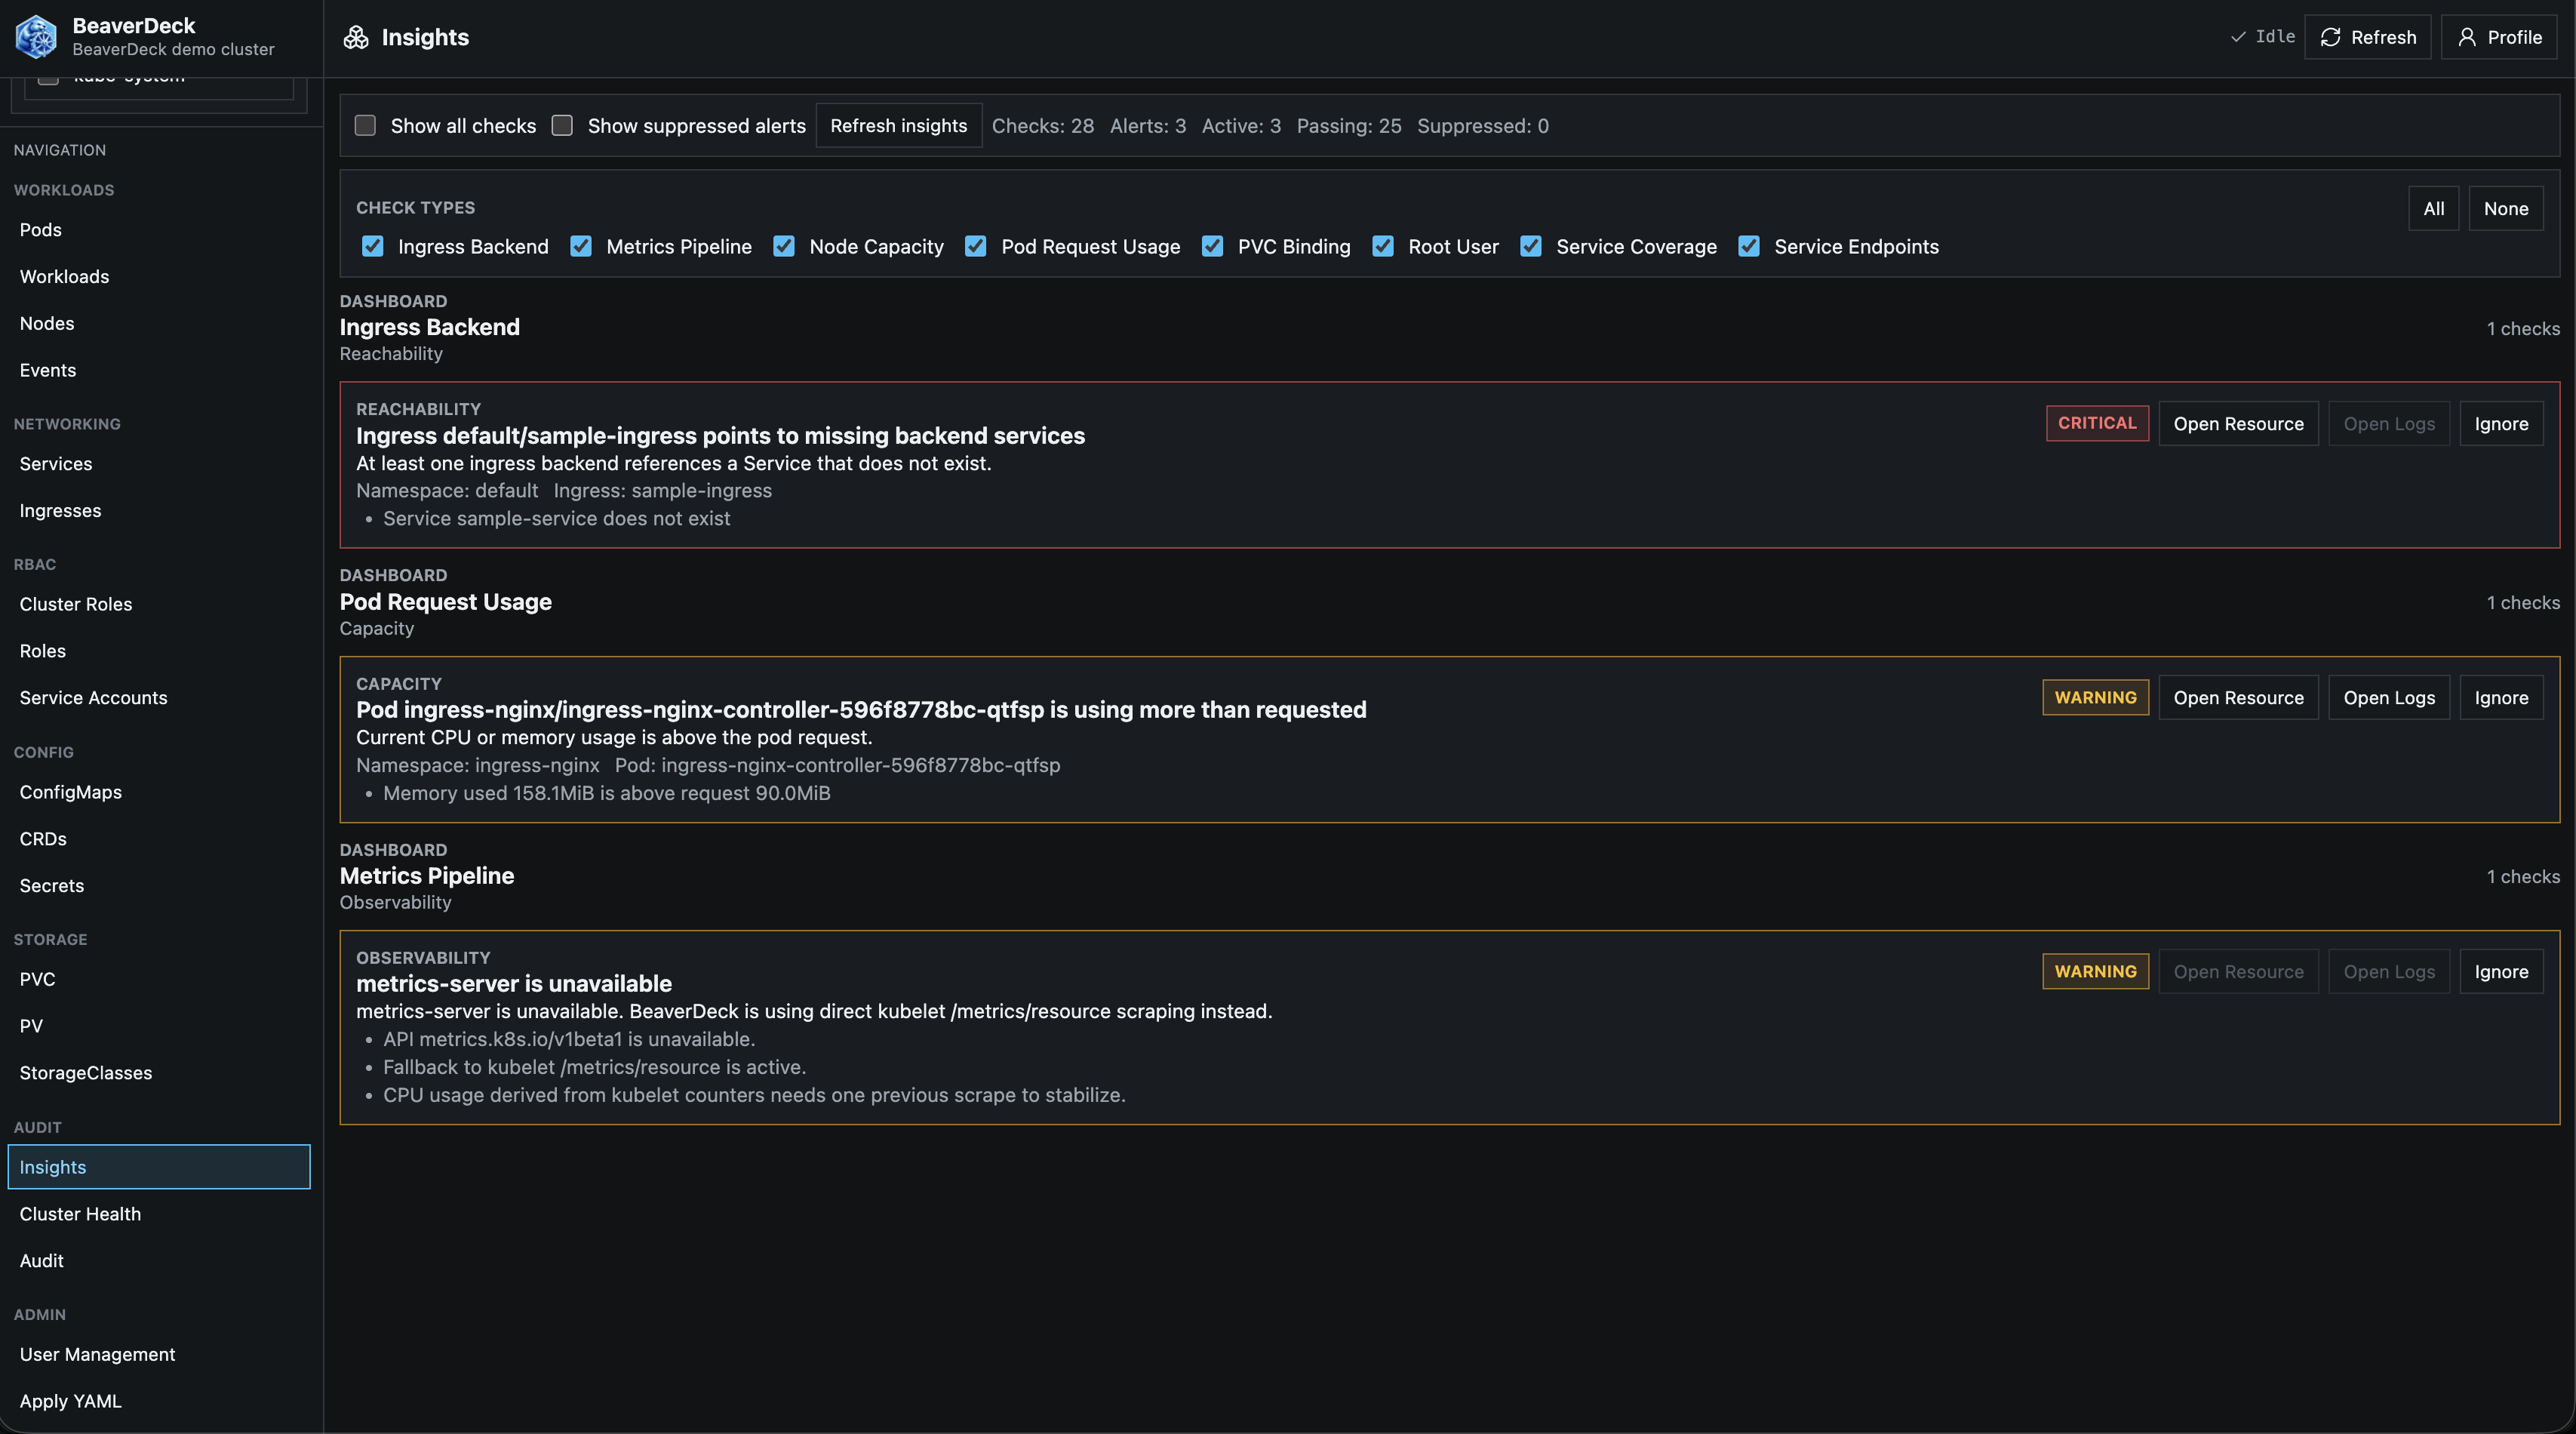
Start from grouped signals, then open the resource, log, manifest, or operation connected to the finding.
Readiness, pressure conditions, metrics availability, GPU visibility, and compute capacity signals.
Pod and controller health, restart patterns, pending pods, resource pressure, and security context warnings.
Ingress and service signals that help narrow traffic-routing issues.
PVC binding state, volume usage, storage class visibility, and persistent storage pressure.
BeaverDeck keeps the confirmation and action path close to the signal.
Install with the official Helm chart.
BeaverDeck stores auth configuration in a Kubernetes Secret. DATA_DIR is used only for
non-auth runtime metadata, such as update-check status.
helm upgrade --install beaverdeck oci://ghcr.io/arequs/charts/beaverdeck \
  --namespace beaverdeck \
  --create-namespace \
  --set clusterName=your-cluster-name